
Showing posts with label Infographics. Show all posts
Showing posts with label Infographics. Show all posts


11 Jul 2018
#INFOGRAPHIC: 38 Benefits of Owning A Dog

The Benefits of owning a Dog:
Health Benefits,
Companionship,
Home Security,
Teaches Responsibility,
and More ...
Via Good Infographics

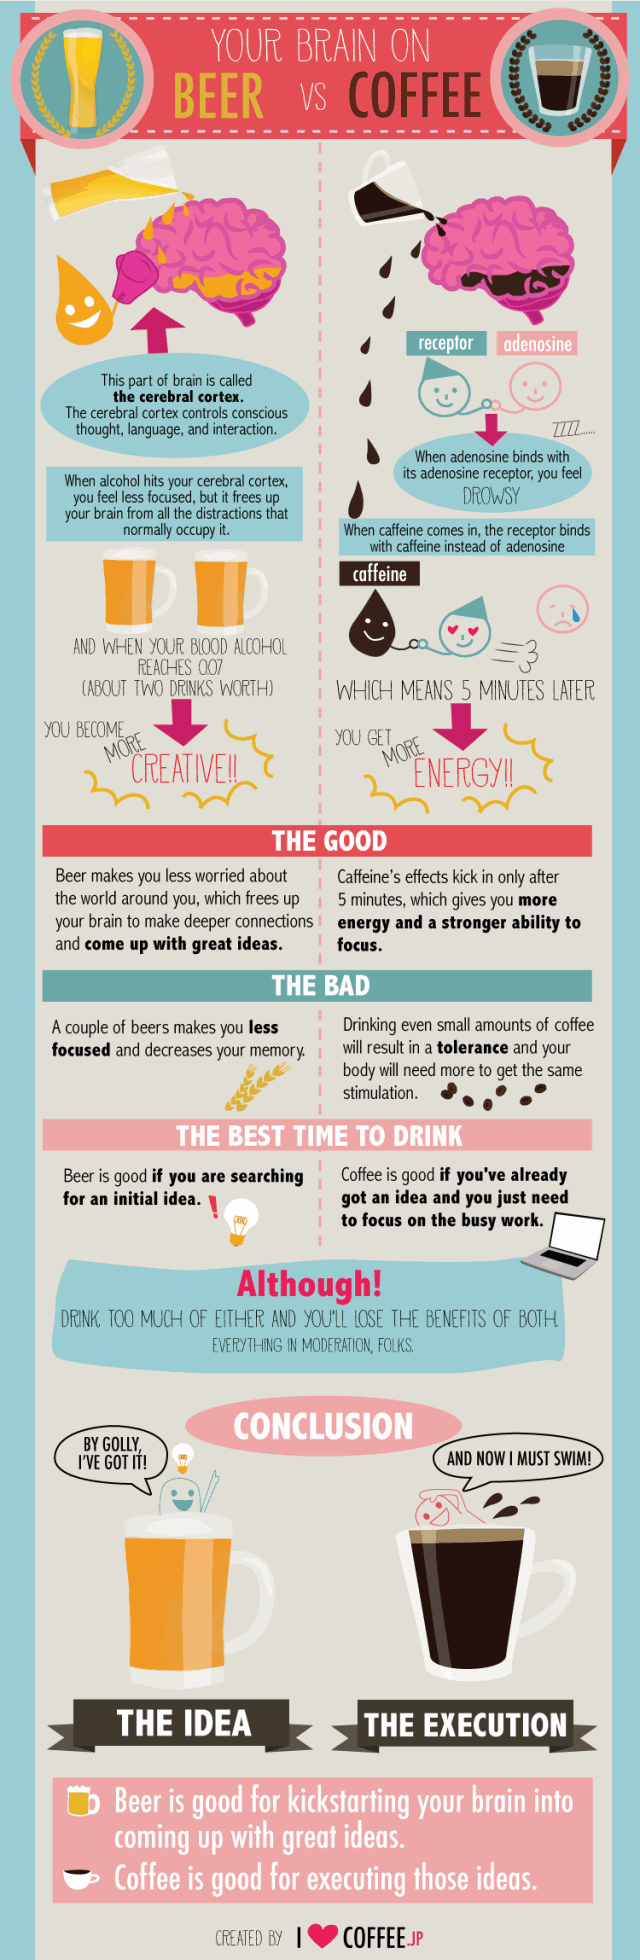
#INFOGRAPHIC: Your Brain on #Beer vs. #Coffee

This raises some interesting questions though. With the knowledge that we have about like alcohol and caffeine, despite their drawbacks it seems that there is supposedly a way to responsibly maximize their benefits. If that’s true then it makes you wonder, are we missing our full potential by not taking the right boosters at the right time?
#INFOGRAPHIC: What Is The Internet Of Things? Learn More About How It Affects Your Life

The internet of things is coming to get you! Just kidding — you’ve already fallen into its trap. But that’s not a bad thing. The term sounds vaguely scary, but it just means technology is rapidly changing.
We can connect to the Internet through our phones and computers, but also our refrigerators, thermometers and security systems. A friend purchased a wireless printer that also plays music. I think it’s cool, but I’m also thinking, “Why does it exist?” Music won’t make a printer more efficient, but I suppose it makes the whole experience a little more pleasurable.
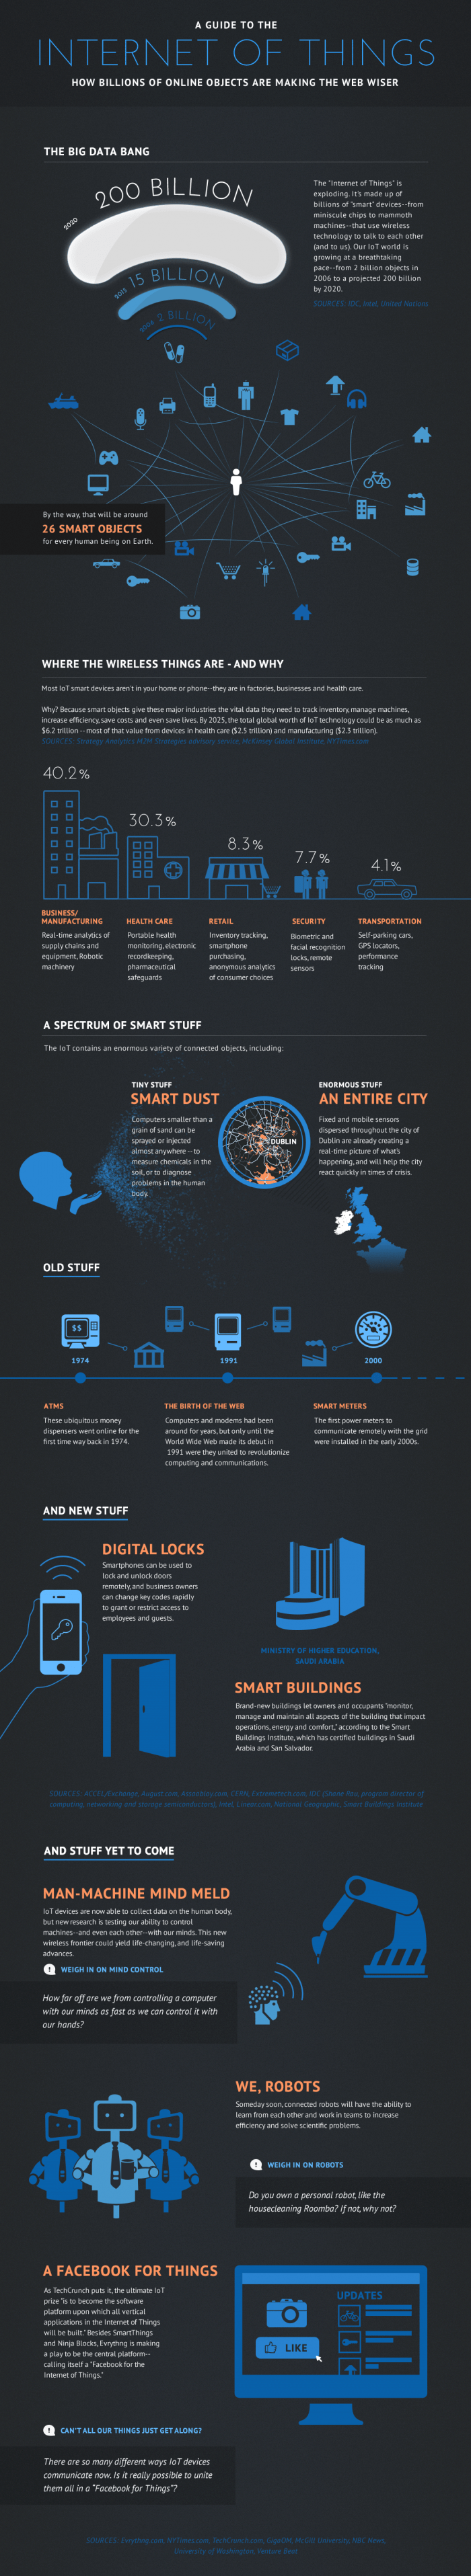
And according to this infographic, technology and the Internet only stand to become a bigger part of our lives in the next two years. Experts predict that by 2020, each person will have 26 smart objects, which means that we’ll become even more reliant on technology than we already are. Forget the Roomba or voice-activated stereo systems. Soon, we’ll look like the characters in Wall-E who whiz around on hover chairs and are fed by robot machines.
If you already use that voice-to-text app to send the text messages you’re too lazy to type, then you’ve embraced the internet of things. It’ll only get more interconnected from here. Find out more about the unwritten rules of the Internet.
25 Jul 2014
#INFOGRAPHIC: The Landscape of Social Login

By Kimberlee Morrison at Social Times:
Facebook is indeed a powerful force on the Internet. Not only have recent reports indicated that the social networking behemoth refers more traffic than any other social site, according to Q2 data from social identity management software provider Gigya, Facebook is regaining its lead — and taking market share from other networks, too.
Gigya director of marketing Victor White attributes this trend to the fact that Facebook makes it easy to auto-populate data across a wide range of services. This is done to create personalized experiences.
There’s also a trust factor at play. During the F8 developer conference, Facebook announced that it was giving users granular social login control, effectively enabling them to control what information they share with business. Of course, we’ll have to wait for the Q3 data to find out if the controversy over recent experiments have had any impact on user trust.
White also notes that the social component is not to be underestimated.
“When users log into a site, they intuitively want to share their experiences with networks of real friends,” he says. “Users know that when they log into sites with their social network credentials, they will be able to share seamlessly with their friends.”
On the other side of the spectrum is Yahoo, which has seen its share of social logins decline steadily over the last few quarters. In March, Yahoo disabled Facebook and Google+ identity management on its online properties — a move that hasn’t had any impact on the free fall in consumers using Yahoo to manage their social identity. White says that Yahoo’s only chance is to provide real value to both businesses and consumers.
“They’ll need to consider how identity can be used to power on-site personalization, social graph integration and potentially even payments,” he says. “Until the company can offer substantial benefits for consumers as an identity provider, Yahoo will continue to lag far behind companies like Google and Facebook.”
Check out the infographic below for Q2 social login data from Gigya:
.jpg)
18 Jul 2014
#INFOGRAPHIC: Global Spending on Facebook Ads Up 50 %

Quarterly spending on Facebook advertising has increased 51 per cent year-on-year in Q2 of 2014, a new study shows.
According to research by predictive media optimisation company Kenshoo, both search and social advertising have seen increases in most metrics both quarter-on-quarter and year-on-year, with advertising spend on search up 25 per cent compared to last year, and a 15 per cent increase on search clicks from last year.
You can find these facts and more in the infographic below.

16 Jul 2014
#INFOGRAPHIC: Tracking Social Media Data
By Christie Barakat at Social Times:
Many businesses make an effort to be active and involved on social media. But information-sharing and interactivity with users does not go far enough. Tracking data and its effectiveness across channels is crucial to examining and altering activity levels and success strategies.
Traffic, the relevance and quality of content, voice, community size, engagement and sentiment can be tracked with measurable data and channel specific tools. Dashboards let you measure data from multiple sites at once. Aggregators are great for discovering Internet trends.
In addition to measuring the success of your social media profiles, other tools let you measure data such as click-through rates, when most of your followers are online and more. Infographicworld.com created the following infographic to break down what you should be measuring, the most useful tools and the capabilities of each.

Courtesy of: Infographic World
11 Jul 2014
#INFOGRAPHIC: A Brief History Of The #Selfie (1839-2014)

By Shea Bennett at Media Bistro:
Back in 1839, Robert Cornelius took a portrait of himself outside his family store. Wikipedia describes the photo as “an off center portrait of a man with crossed arms and tousled hair”, and the first-ever selfie was thus born.
The first recorded use of the hashtag #selfie took place on Flick in 2004, but the word didn’t really enter the public lexicon until 2012. Since then, the use of selfie across social media platforms such as Facebook, Twitter and Instagram has skyrocketed by 17,000 percent, and in 2013 the word was added to the Oxford English Dictionary.
Check the visual below for a lot more about the history of the selfie, which comes courtesy of Sony.

10 Jul 2014
#INFOGRAPHIC: The ROI Of Social Media

By SlideWorld at Visually:
Do you spend hours on your social media outreach and have no idea if it’s successful?

9 Jul 2014
#INFOGRAPHIC: How to Respond to Negative Comments On Your Posts

By Steven J Wilson at Visually:
You have spent hours preparing an amazing post or share something worth a meaningful discussion. Then you notice that a couple of people are saying the complete opposite from what you have shared. Ths is normally fine except they express their opinions in a way that may rub you the wrong way. How do you handle this type of situation? Do you lash out in order to get your point across, not respond at all, delete the comment or just flat-out ignore it?


7 Jul 2014
#INFOGRAPHIC: The Science of B2B Online Marketing

By Tim Asimos at Circle Studio:
Doing” B2B online marketing is not going to maximize success, and your website isn’t going to just magically generate new business because it’s there and it looks good. You need the right strategies to attract visitors and convert them to customers.
There are a lot of moving parts with a B2B online marketing and lead generation program, so we’ve designed this infographic to help you visualize the components and the overall process.
The Science of B2B Online Marketing infographic designed by circle S studio.
![The Science of B2B Online Marketing [INFOGRAPHIC]](http://www.circlesstudio.com/blog/wp-content/uploads/2014/01/the-science-of-b2b-online-marketing-infographic-circle-s-studio.jpg)
19 Jun 2014
#INFOGRAPHIC: 7 Tips for Posting on Forums

Many people who are new to the forums do not know what to do after joining and how to go about posting a query which many times results in posting irrelevant questions or posting in wrong forums. Here is an Infographic about 7 tips for posting on forums to help you work around forums with ease.

1 Jun 2014
#INFOGRAPHIC: Most Powerful Blog Promotion Tactics by Marketing Experts

So you’ve got your blog up and running, and you’ve been writing a bunch of quality posts. Yet the traffic isn’t quite what you wish it were. What do you do?
Well, Brian Lang from Small Business Ideas Blog asked precisely that question to over 40+ experts from fields as diverse as SEO to (believe it or not) Real Estate. We took the information and laid it out in a coherent infographic. Enjoy!
![The 9 Most Powerful Blog Promotion Tactics From Top Marketing Experts [Infographic]](http://cdn.referralcandy.com/images/9-most-powerful-blog-promotion-tactics-top-marketing-experts-590g.png "The 9 Most Powerful Blog Promotion Tactics From Top Marketing Experts [Infographic]")
ReferralCandy - Refer-a-friend Programs for Ecommerce Stores
29 May 2014
#INFOGRAPHIC: Top Social Efforts to Boost Referral Traffic to Your Website

By Thomas J. Armitage at Social Media Today:
Social media has many benefits for a brand. Raising awareness, generating buzz around events or news, keeping your name or products top of mind, managing customer service, gathering consumer-generated content, market research, and the list goes on. But for some reason, many of us get hung up on the fact that social media has to have an immediate, short term return on investment. Many social strategies are long term investments, so when looking at a tight time frame, we migrate towards metrics that try and allow us to justify our efforts. Enter: referral traffic.
Referral traffic is a very important thing to measure within a social media campaign. For many companies, bringing visitors to your website helps them learn about your products and services and establishes one more touchpoint in that very important buying process. It gets the user away from all the chaos on social media and lets them solely focus on one thing…you. And that’s valuable stuff. So after using many social media channels over the past few years, I’ve learned which ones generate the highest return on investment, based on time/cost vs referral traffic. Of course numbers will very based on your industry and the content you’re producing, but for the most part, this will give you a simple indication of which channels are best for driving traffic back to your website.

1) Blogging
The only one with 5 stars in terms of referral traffic is blogging. Are you surprised? If on a subdomain, blogging can be tremendously helpful to sending traffic to your website, if using links properly. If housed on the company site itself, blogs will generate organic traffic from search and attain visitors from referral links from any sites or bloggers who re-run your material or cite your writing. A misconception is that this effort is free but it is one of the biggest investments your company can make in the social space. The best blogging companies invest tons of time and resources into blogging efforts. Beyond time for writing, you will want to budget money for stock photography or time for your design team to create custom graphics, infographics, charts or visuals to supplement your material within the post and/or for social media when distributing. It makes the world of a difference in getting people to read, react and share your content. It's also helpful to promote your blog articles on social using ad dollars to "light the fire" and get the traction rolling.
2) E-Newsletter
Email marketing may not be the best approach to reach your teen audience (most do not use email with the exception of using it for registration purposes) but email is still widely used among most working professionals. It’s a great way to reinforce messages, introduce the latest news to a loyal audience, and keep them coming back to your site. Carefully design a layout – don’t have too much information there – and drive people deep into your site on specific landing pages, not just the homepage. Tell them what you want them to be looking at. Costs here are associated with monthly software fees (MailChimp, Constant Contact, etc), stock photography, design costs, and the time it takes to prepare and distribute. Your list is critical. Always be conscience about growing this – whether it’s through other social channels, events, contests with registration walls, etc. Your list is powerful in bringing visitors to your site.
3) Twitter
Many of us know how great this tool can be at luring traffic to your site. But this audience is very cautious what it clicks on – simply because we are being bombarded with hundreds (or perhaps thousands) of tweets each day. Because of this, be strategic when you include a link to your own site. Always use the old adage “What’s In It For Them?” Push them to an educational blog posts, a cool new product, a fun contest going on, etc. Be creative and straightforward in your limited description too, because you have to convince them to click in less than 100 characters or so. Costs here are related to stock photos or designs you’ll want to use to pair with your content. Also, do not overlook Twitter advertising. It’s a great way to get new users in front of your material and you can select the type of person that is most appealing to your business, so it works well.
4) LinkedIn
Of all the promoted post-style advertising on social media, LinkedIn can often times be the most expensive. But it’s a great way to get highly targeted people in front of your content and lead them to your site. The filters available through LinkedIn are extraordinary, allowing you to target by age, geography, profession, industry, hierarchy, group, and more. Naturally, you’ll pay for this luxury in your higher cost per clicks. But regardless, it can be effective. LinkedIn readers love tips on how to do their jobs better, motivational articles, and the inside scoop on new jobs available in their fields. Keep this in mind when sharing material that refers back to your website. You don’t want them to be disappointed when they go for that click. So make sure it’s meaningful and in line with the type of professional readers that are here.
5) YouTube
I have YouTube listed as the most expensive of all the tactics. Because quite frankly, video production ain’t cheap. Sure, you can get away with haphazardly winging some videos together and throwing them up online. You might get a few views. But ever notice the ones that we gravitate towards every week (if they are a regular series) or the ones you pull to use in presentations or demonstrations. You and I both are using the ones that look professional, are in high definition, boast great audio quality, and subtly use visuals as examples to support the verbal discussions. You’ll need lights, microphones, a great camera (preferably two), lots of time and research, a personable and lively spokesperson, and more. But here’s the bright side. Of all the types of content available to you, in my opinion, videos are the one type that is most likely to really take off if done right. You can include links in your description area or within the videos themselves. And finally, you can expose your messages to more people through advertising (which again, costs money on this platform). But think about all the embeds and shares you can get if your videos are valuable to your target audience. In all, YouTube can be one of the biggest spends in your social media budget but can also see one of the greatest returns on investment, especially in terms of referral traffic.
Social media has a variety of benefits. Gaining visitors to your website is only one – though an important one if it matches your goals. Share content that is worthwhile and carefully select the channels that you wish to invest in to see high levels of return. Keep in mind that you don’t want to *just* share content about yourself – social media is all about sharing the wealth and getting involved in conversations that are out there on the web. But being selfish every now and again to impact the bottom line is a no-brainer.
Which channels, in your experience, have you seen bring about the highest levels of referral traffic?
Authored by:
Thomas J. Armitage
Thomas J. Armitage is a digital marketer and PR professional with a concentration on social and new media. He helps lead the social and content efforts at Site-Seeker Inc and has a track record of researching, interpreting and executing the latest and best tools/techniques available to clients. He is also an adjunct professor at Utica College where he teaches on PR and social media.
21 May 2014
#INFOGRAPHIC: 22 Rules to Reach Your Facebook Fans Today

When Facebook changed its algorithm again, many brands — we’re betting MOST brands — noticed a major decrease in their organic Facebook reach. It used to be around two percent and now it’s closer to one percent. While this is undoubtedly frustrating, we’ve focused our attention on working with the new Facebook reality instead of fighting against it (and/or complaining about it!).
Designed By Lea Heckley, Published by Shortstack.

22 Apr 2014
#INFOGRAPHIC: Guide for Small Businesses on Facebook

By Mona Zhang at SocialTimes:
For small business owners, launching a social media presence can be a daunting task. Which platforms should I be on? How much time and money should I be investing? And, of course, the ever-vexing question: What’s my ROI?
Step one is to decide which social platforms to invest in. Here’s some advice from Peter Friedman, whose guest post on SocialTimes can help you figure out which sites make the most sense for your business:
When companies worry about overextending themselves on social, I tell them to start out in one channel rather than spread themselves too thin. Different channels also lend themselves to different levels of interaction. Twitter is primarily experienced as a newsfeed, constantly streaming by, so conversations tend to happen in real-time. Meanwhile, Facebook’s page format supports asynchronous communication, so it may be a better choice if you don’t have full-time resources for social. Get to know each of the platforms and how various brands are using them before you commit to a direction for your company.
If you’ve decided that Facebook is the right platform for your company, this guide for small businesses on Facebook can help you get started:
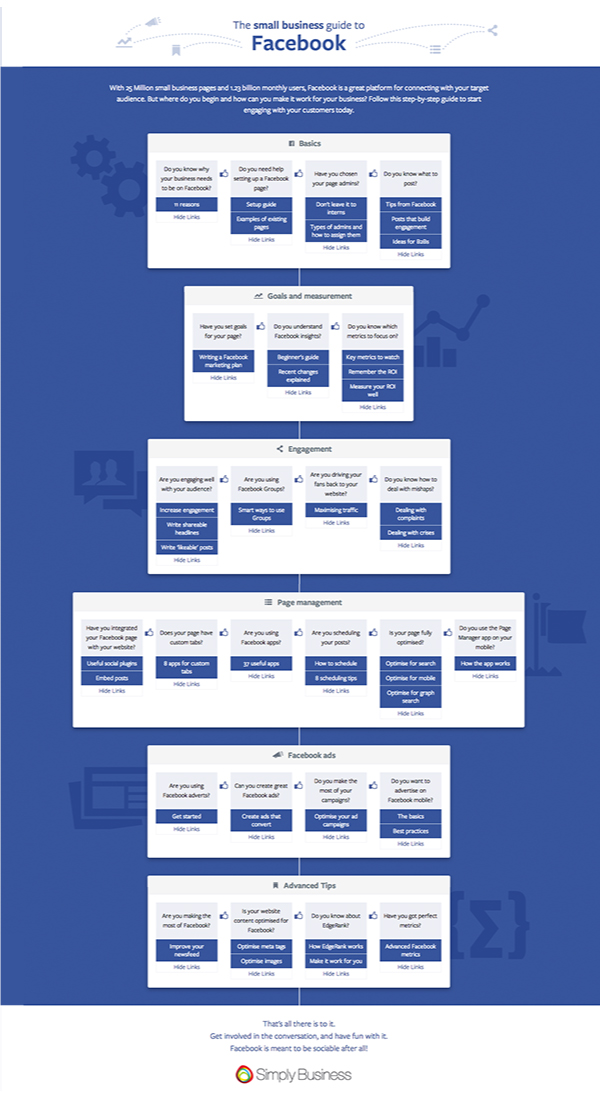
Are you a small business owner thinking about setting up a facebook page? Don’t know where to start? Check out our step-by-step guide. (via SimplyBusiness).
13 Apr 2014
#INFOGRAPHIC: The A to Z Guide to Personal Branding

By Barry Feldman at Social Media Today:
I’m a brand. You’re a brand. Tom, Dick and Harry? Brand, brand, and brand.
But Tom started it. Yes, I'm talking about Tom Who-Wrote-a-Ridiculous-Number-of Non-Fiction-Best-Sellers Peters.
It was 1997. The web was just a baby. Maybe you were too. I was no baby, but I was practicing personal branding. I just didn’t know it. I had started my business just two years prior, so I was brand-building semi-obliviously.
In an edition of Fast Company magazine, in an article titled, “The Brand Called You,” Tom Peters declared it a brand new world. He wrote, “To be in business today, our most important job is to be head marketer for the brand called You.”
Seven paragraphs later, he said, “The web makes a case for branding more directly than any packaged good or consumer product ever could.”
Then he made a bit of a crystal ball statement. “When everybody has email and anybody can send you email, how do you decide whose message you’re going to read and respond to first and whose you’re going to send to the trash unread? The answer is personal branding.”
Then he hung up his dial-up modem and kept writing.
Person branding guru Dan Schawbel was just 14 at the time.
It would be 10 years later when Dan took the baton and ran with it in his book, “Me 2.0.” The New York Times dubbed Dan a “personal branding guru.”
In the first chapter, Dan pointed out 10 years prior entrepreneurs primarily connected offline through networking events. People spent decades working for companies, often hanging around until retirement. They had few networking tools.
New century, new rules.
Job security doesn’t exist. When you’re looking for a job, your GPA will likely take a backseat to your communications skills—writing, social media, presenting.
Obviously, with the second wave of the web—Web 2.0—comes a massive shift in how things work. Unless you want to give in to becoming increasingly irrelevant, you have to recognize communications go both ways, community is all-important and the mark you make online is the heartbeat of your brand.
To the individual, personal branding is almost a survival tactic. I think it’s a fun fight, but let’s be real. You need new strategies and a wider roster of skills.
I’ve been working at them, and lately, working hard to share what I’ve learned. I offered important personal branding tips from Michael Hyatt and me on my blog, The Point. In another post, you can also read about a way to gauge your progress by doing a search for yourself.
I also created an infographic, where I consolidate and alphabetize 26 of the best tips I’ve gathered. I hope you get something out of it.
6 Apr 2014
#INFOGRAPHIC: 8 Ways to Increase Website Visibility

There are thousand of ways out there to improve your website’s visibility. Now we will show you 8 important ways to achieve that.
Via InfoCC:
