

As the popularity of smartphones and tablets continues it is no surprise that people are increasingly consuming digital content on these devices and sharing it with their friends.
Uberflip researched key usage data from February 2010 through February 2013, using Google Analytics and Uberflip Metrics, and then used the data to produce the following infographic.
Over one-fifth of global traffic now comes from digital content consumption at the expense of our declining interest in turning on the Desktop (desktop traffic continues to decline steadily). This trend is reflected in email open rates on mobile phones – see infographic.
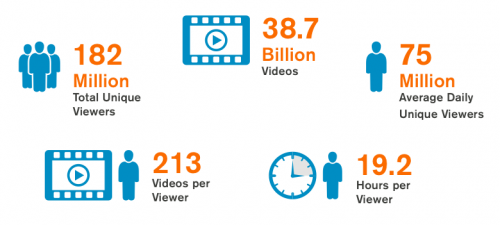
In 2010 video content accounted for only 6% of users incorporating video into their digital content. But with a rise of over 3.7X it is a good reflection of video as a key component of content marketing by brands. A figure supported by comScores 2013 U.S. Digital Future in Focus’ report.
As more sites have now added share buttons and integrated social media it has become easier to share content socially than ever before. In February 2010, people preferred to share content via email but now sharing content via email has decreased from 93.3% in 2010 to 53.3% in February 2013. What changed? the popularity of Facebook, which grew from 3.4% users sharing content via the social platform in 2010 to 27.4% in 2013.
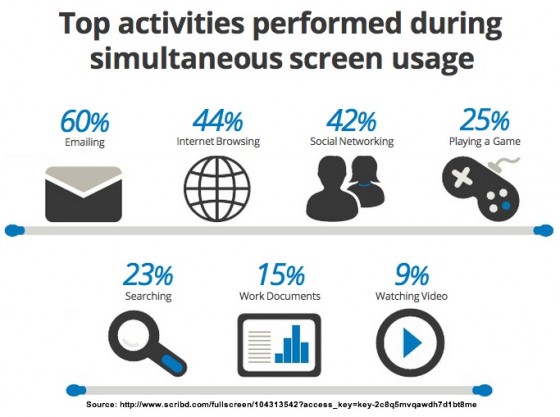
With people also multi-screening now it is inevitable that we will see further growth of videos and pictures will continue to rise. The state of digital content will increasingly be videos and pictures but also I believe we will start to see more interactivity as well.

Thanks for the post. Great infographic!
ReplyDelete